I’m starting to play around with “nowcasting” – doing weather forecasts based on recent rain radar images. The Met Office provides a feed of radar images you can get from their Datapoint service.
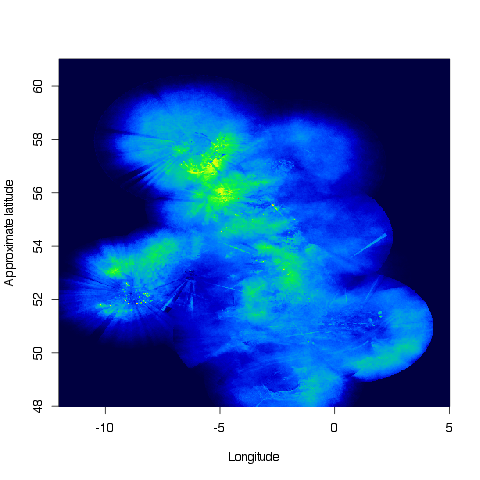
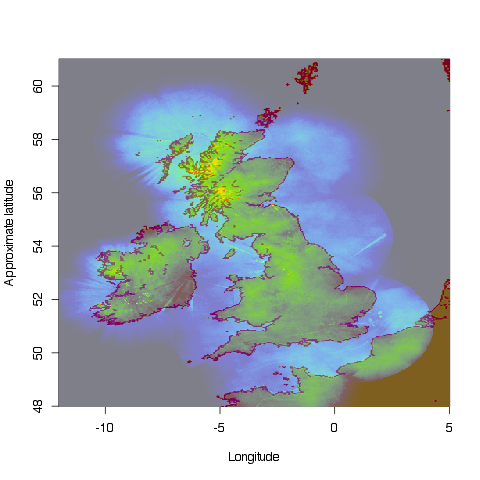
The first plot I made of the data was number of rainy 15 minute periods during May (shown with and without a base map):
There are many interesting features here. Firstly a few probably true observations about rain:
- You can clearly distinguish land and sea – there is more rain over land.
- You can see hilly regions with yet more rain.
However there are many other features that I guess aren’t true observations about rain:
- You can see the two shipping lanes in the English Channel with the separation zone between them.
- You can see the individual radar sites don’t give uniform coverage in all directions.
- There are other linear features of which I’m not sure of the origin – any ideas?
All these features suggest that I can’t treat this data as perfect truth data for nowcasting. 😦


